Who Will Win the World Cup? A Method to Predict the Future
Several weeks ago I tried to predict who would win the World Cup. I faced this interesting problem I want to share: how can we relate the outcome of the World Cup with the strength of the teams? Let me explain it better: How can we account for the fact that some “lucky” teams play easier matches than others and thus most likely will arrive to a better stage?
After thinking about it for a while, I managed to code a nice python script to predict the winner of the World Cup, or in general to predict the outcome of a similar tournament. The idea came from a nice tool I used from my past experience as a physicist. It is called the Monte Carlo method. This method is widely used in finance, math, physics and statistics, and has been used in the last century for realizing the first atomic bombs and in the past to empirically find Pi (for some primitive variants, see http://en.wikipedia.org/wiki/Buffon’s_needle).
The basic idea begins with assigning a probability to the goals of every single match and then simulating the full tournament. The workflow to predict the winner is the following:
– simulate a single match
– simulate a tournament
– repeat the procedure a lot of times to collect all the winners
We must be able to decide what the score is in order to create a single instance of a specific match. To be specific let’s try to simulate the outcome of Brazil – Croatia, the opening match of the World Cup.
To this aim, we need to create a “distribution of goals” which means: “a team will score n goals with a certain probability”.
In the best case scenario, we know already all the history of this matchup. For example, if Brazil and Croatia played together 1000 times we would be able to simply count how many times Brazil scored zero goals, one goal and so on, and obtain the goal distribution from that data. The same argument can be given for Croatia.
Unfortunately, in the real world, Brazil and Croatia (and all the other matches) haven’t played together enough times to draw a conclusive statistic, and also, in general, it would be very difficult to gather such a vast array of data.
A solution to this problem is to use – instead of the real distribution – an easier distribution. A good choice for simulating a match is the Poisson distribution. Without going into the details of how it is defined, I just want to list two important characteristics of it:
1. it can nicely represent the distribution for a goals of a team in a match (see pictures)
2. it can be created knowing just one parameter, the average number of goals

An example of real goal distribution obtained from the goals in Premier League matches from 1992 – 2010

The Poisson distribution, dependent on the average number of goals lambda
So now the problem is just to define the average number of goals that Brazil scores on Croatia, and vice-versa.
Here’s the trick. I can estimate how strong Brazil is and attack from the average number of goals it scores (since it is not referred to a specific match, it is easy to obtain that data). I can estimate how good Croatia’s defense is from the number of goals conceded.
In this case, my average number of goals scored from Brazil to Croatia will be calculated as:
averageGoalBrazilToCroatia = brazilAttackPower / croatiaDefensePower
In a similar way, I can estimate the average number of goals scored from Croatia to Brazil.
The next step is to generate the two Poisson distributions: goalBrazilToCroatia and goalCroatiaToBrazil. We can easily build them because we know the averages (property 2).
Once the distributions are created, we just need to pick up one number from the first and one number from the second. They will respectively represent the goal scored from Brazil to Croatia and the goal scored from Croatia to Brazil, i.e. the result of the match.

10000 Brazil – Croatia simulation, first 52 results are listed
Given the algorithm to create a single match, we can simulate all the tournament. From the group stage to the final and therefore be able to predict who will win the World Cup.
Obviously, this is just one match of many in the World Cup. However, the formula is intact, and can simply be repeated over and over to anticipate which teams are truly ranked highest to win it all!
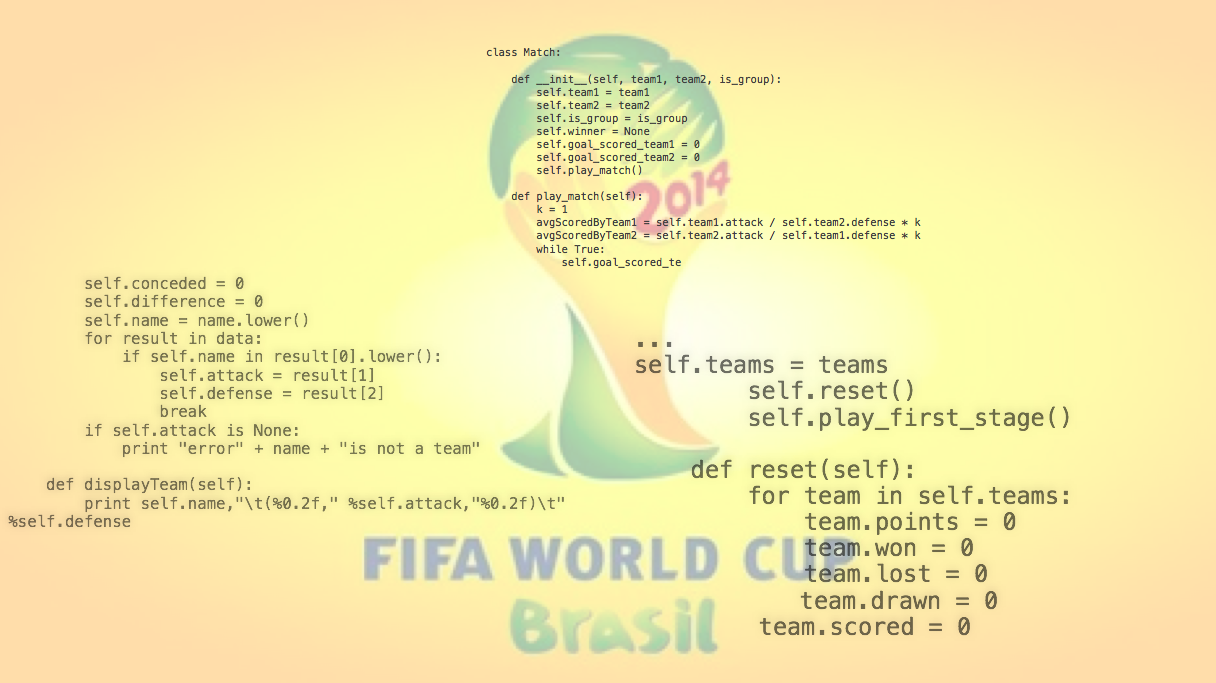
Here’s the python script used to simulate the outcome.
Both the input data used and the outcome of the simulation are shown in the pictures. The simulation is done assuming the World Cup hasn’t started yet.

Input data for the script

Outcome of the simulation