Modeling User Interfaces with Statecharts
As developers and designers, we are creating new things every day. I like to say that we are really good at making the impossible possible. In fact, some of us are so good at it, that we actually do it unintentionally. These unintentional outcomes that occur when we are creating code are called “impossible states.”
Impossible state problems plague every project, regardless of the talent and attention of the designers and developers. Though the cause of the impossible state can vary, they all arise from the same problem: we need a better underlying model for our state.
In this post, I will introduce statecharts and show how a statechart model can help decrease the number of impossible states that are encountered during the creation of an application.
What are Impossible States?
Impossible states arise when issues in the code send the user to a location within an application that should not have been possible. Impossible states can stem from a number of causes:
- We changed the application logic and the user interface (UI) got out of sync
- We tried to take a shortcut that had unexpected side effects
- We forgot to reset a condition
- We missed an edge case
- We didn’t handle an API response properly
- …

In our most recent project with Sutro, we encountered several of these impossible states. The Sutro Smart System is a water bottle-sized device that sits in a pool and monitors the chemical properties of the water. Internally, the device is powered by a replaceable cartridge. When the user first sets up the device, and whenever you replace the cartridge, the device must be calibrated using a smartphone application.
When developing the application, we dealt with two different bugs that were caused by impossible states:
- When the user opened the app, they were told they needed to calibrate their device but at the same time the “start calibration” button was disabled.
- When the user tried to recalibrate the device using the application, they were incorrectly told that calibration was already in process, even though calibration was not in progress.
Both of these impossible states, as well as the impossible states we encounter in every other project, are symptoms of the same underlying problem: we need a better model for our state. As the code for applications has evolved and changed, we’ve grown beyond the models we typically use.
There’s no better demonstration of this than in this hardware flow diagram from the Sutro application:

This flow diagram represents only a small percentage of the overall logic and communication happening between our application, our server, and the hardware itself. As these flow diagrams get more complicated, it is no surprise that it becomes more and more challenging to translate them onto a phone screen that is easily accessible for users.
Finite State Machines
The model we need is a Finite State Machine (FSM). As the name suggests, a FSM is an abstract machine that can be in exactly one of a finite number of states at any given time. Even if you’ve never heard of an FSM, you probably already instinctively know how one works, which makes it a great choice for modeling UIs: we are already used to thinking with a FSM mindset.
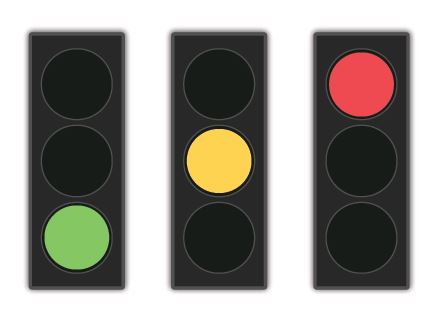
For example, let’s think about a traffic light. If the light is green, we all know what color it will transition to next. No matter how many times you iterate through the lights of a traffic light, we all know that it will always follow the order of green, yellow, red, and green. The traffic light can be easily modeled as a finite state machine.

Rules of Finite State Machines
- The machine can only be in one state at any given time. This rule applies to the traffic light. The light will never be both green and red at the same time.
- There are a finite number of discrete states. Each state in a FSM should be clearly distinguishable from the others. In other words, you are able to count all of the possible states of the traffic light and define what they are.
- The machine transitions from one state to another based on an event. In the traffic light example, the event is typically a timer running out on the traffic light, a car triggering the sensor, or some event that causes the light to lose connection with the rest of the control system.
Knowing these three rules, you can begin to imagine how this system would manifest in modeling actual UIs and translate into acceptance conditions. For example, look at the following situation:
- As a driver, given the light is red, (current state)
- When, 30 seconds have elapsed, (transition event)
- Then, the light turns green. (next state)
In design, this translates precisely to the interactive prototypes or user flows you might create. Your screens or frames become your finite states, and you enumerate all of the possible transitions between them when you connect two frames.
In code, there are libraries for building FSMs in nearly every language. I will cover the code for FSMs in more detail below. However, for a simple example you can look at the following:

As you can see, you can implement a simple FSM with a class that takes an initial state, a schema with all of the possible states and the transitions between them, and a transition function to call. This FSM can then be tied into the UI with a switch statement.
Finite States Machines and XState
Here are some examples of FSMs in JavaScript using a library called XState. I prefer using XState for the creation of FSMs because it has a strong TypeScript support and its own visualizer tool which looks like this:

In this snapshot, I am inspecting a FSM that I built for the basic three-light traffic light example. The XState visualizer includes the current state (green), as well as the other available states and the transitions you can use to get to them. The machine code for the traffic light looks like this:

In this code, you plug the configuration object into XState’s “machine” function, and then you can run the FSM wherever and whenever you want. I specified that the initial state is “green,” and then I defined three individual states (green, yellow, and red) and when and where each of them transitions when they receive an event.
Now, if I wanted to add a fourth state, such as a red blinking light when the signal’s connection is lost, I could add a “signal lost” event transition for each of the three states. However, every time I then added a new state, I would also need to remember to add a “signal lost” event transition to the new state as well. While this is easy to do in a simple example like this, in more complex code it quickly becomes convoluted.
Instead, I can use XState to organize different states. For example, I can nest the original three states in a main “connected” state. If the traffic light loses its signal, I can then transition to the “disconnected” state, which shows the flashing red light. Once the signal is restored, the light transitions back to the normal “connected” state.
The FSM with nested and/or parallel states is called a statechart.

Preventing State Explosion
Statecharts are state machines that can have hierarchies of nested states, as well as parallel states. These two features work together to make statecharts very effective at preventing state explosion.
State explosion looks just as terrifying as it sounds.

State explosion occurs when the number of states and transitions you have grows beyond a reasonable amount. For example, the photo above shows an example of a regular FSM for just a single input field in a questionnaire.
In this example, you see a different state depending on if your input is “changed” vs. “unchanged,” “valid” vs. “invalid,” and “disabled” vs. “enabled.” The arrows between the events represent every transition that can occur. As you can see, it can get complicated pretty quickly.
However, when we use a statechart, we are able to keep the system much more streamlined:

As a statechart, we can represent “enabled” vs. “disabled” as a parallel state because their transitions do not affect any of the other states. In this example, we have also created a nested state by deciding that an input can only be “valid” if it’s also been “changed.” As this example depicts, a statechart allows us to minimize the number of transitions required and represent the various states in the UI much more succinctly.
Rewriting Calibration Flow as a State Machine
Most applications are not as simple as a three color traffic light or a prompt on a questionnaire. You are therefore probably wondering how successfully statecharts scale to something more complicated.
The calibration process for the Sutro application walks the user through several steps sequentially.The user starts on the dashboard, where they are given a prompt to complete the calibration. When they begin the calibration, they are then taken to precheck1, precheck2, and the prime function, where the calibration is performed. Assuming every step is successful, the user is then taken back to the dashboard once the calibration is complete.
To start building a statechart for the Sutro calibration, I began by defining all of the states. For the purposes of this post, I have consolidated the calibration into the four steps mentioned above, each of which represent a separate state in the statechart.
Next, I needed to create states that are triggered when each of the steps fail. To do this, I created a nested state system in XState:

I split each step into two states: the checked state (where the hardware performs its calibration test) and the error state (which appears if the check doesn’t succeed). As you can see above, each step begins in the check state and if an error occurs, it transitions to the error state. From the error state, it can then perform a retry, which transitions it back to the check state. If the check state succeeds, it then transitions to the next step in the calibration process.
From the standpoint of the user, when the calibration is started, the user sees that the application is communicating with the server to perform the first precheck. During this time, the statechart communicates with the server using the “activities” function.
An activity is an action that occurs over time and can be started and stopped. In this case, the activities function runs a polling activity, which uses an asynchronous application programming interface (API) to get an update from the server. Once a success or error event occurs, the activities function is stopped.
This initial statechart setup already prevents several impossible state scenarios. By setting up states and transitions in this fashion, it ensures that the system will always respond in the same way. For example, if multiple errors were to be triggered in rapid succession in a typical infinite state machine, additional code would be required to prevent them from triggering something within the UI. However, with the statechart, the application responds the same to multiple errors as it does to a single error, ensuring that the UI remains usable.
Context in Code
The next thing I needed to think about was how to resume a calibration session if it was abandoned mid-session. I chose to treat an existing calibration session as “context.” While finite states are well-defined, states that represent quantitative data are represented by something called “extended state” or “context.”
In the code, I defined a TypeScript type for the device’s context with three fields: needsCalibration, status, and step. This keeps track of whether a calibration has been started, as well as the status and step of the calibration session on the server.
I then placed the device code in a wrapper function, which allowed me to set the initial context based on the information from the server. Using another statechart concept called “guarder transitions,” I ensured that a new calibration was only started if there wasn’t already one in progress. If the system was mid-calibration, it would instead direct the user to the last step the calibration was on before the application was closed.
As you can see from the following XState visualizer, each guard event (in blue) points to a different target state depending on which conditions are met when the application is opened:

From the user’s point of view, when they open the application, instead of starting a calibration, they will be given the option to resume the calibration and will then be sent directly to the step that they were last on.
Automatic Event Transitions
The final step in the creation of my statechart was to automatically send events to transition from one state to the next when the calibration conditions were met. For precheck1, I added the context type of the four status checks that the application pulled from the server. The application checked that the firmware was up to date, the lid was closed, the battery was charged, and the cartridge was properly installed. Only if all four of these checks were met could the application proceed to the next state.
When the application transitions from the dashboard to precheck1, it immediately begins receiving updates from the server until the status of all four checks has been received. Once the status of all four checks is received, the application then transitions to the next state. If any of the four checks fails, it transitions to the error state, which prompts the user to retry precheck1. If all four checks succeed, it automatically transitions to precheck2 and begins receiving the precheck2 updates from the server.
From the standpoint of the user, these automatic event transitions keep the application running smoothly and minimize the number of tasks that the user must complete. They also help to minimize impossible states by clearly defining the rules within the code.
Takeaways
Hopefully, you now have a better understanding of what statecharts are capable of, and how we can use them as a model to manage the application state of complex processes. After working with statecharts, I believe some of the most important takeaways include:
- Keeping UI in sync with application logic is universally hard. Sutro isn’t the first application to run into impossible state bugs and it certainly won’t be the last.
- Having implicit state machines as the basis of your logic makes things harder all around.
- You’re probably already thinking with FSM logic. It’s natural to break processes into steps, especially when it comes to software. Even if you’re not thinking with FSM logic, it is a very easy muscle to train.
- Statecharts are just beefed up FSMs that give us handy extras, such as nested states, parallel states, and activities. However, at the core, we are still dealing with finite states and the transitions between them.
In conclusion, you should definitely consider using statecharts to help you model your UIs. Whether it is through generating acceptance conditions, guiding your design prototypes, helping to maintain the integrity of your code base, or enabling you to automate all of your integration tests, statecharts are a great tool with innumerable benefits.