Maximizing Your Logs with CloudWatch Logs Insights
When you run your application, it generates logs that record pertinent information about the activity, or records of events. These logs, which can contain essential information about your app, its users, and everything in between, can be incredibly beneficial sources of information. Effective logs allow you to stop making assumptions about what’s happening in your code and instead focus on informed decision-making. However, the data is virtually useless if it isn’t stored, searched, and analyzed correctly.
In this post, I’ll provide a brief overview of good logging practices and examples of how you can use CloudWatch Logs Insights, a program designed to help you interactively search and analyze your log data, to better consume the logs you generate for your application.
Why Log?
Logs can be much more efficient than other means of deriving data out of your application. For example, with effective logs, you can generate a report, send an email, or debug via the console in a single step. Loglines are always tracking, so, assuming you set them up correctly, you can use them to grab the data you need very quickly.
Logging is ideal for high-traffic endpoints because logs do not require a database write at any point. It is also an easy way to provide information across models and concerns all in one line.
When to Log
You generally log at two main points during the lifecycle of your app:
1. Local Logger for Development: These logs occur during development for simple checks, such as print debugging. As a result, longer logger functions are not typically required.
2. Deployed Logger for Debugging: These logs give you the ability to carve into the data in real time to make intelligent decisions about what’s actually going on in the application.
When you are logging in a deployed environment, you want to make sure you are using a universal log function to standardize your output. If you’re doing a test deployment for a short-term issue and it’s not going to be a permanent fixture in the code, then you can place the logs as you see fit. However, for anything you may want to monitor long term by leaving a logger in your code base, you want to make sure you have the ability to toggle it on and off (e.g. logger(…) if App.log_x_thing_setting).
Logging Best Practices
If you want to maximize the benefits that your logline provides, consider following some of these best practices:
- Strive to convey one logical evaluation per log inserted. Don’t convolute your logs by including lots of data that isn’t relevant to the same topic.
- Be thorough. When you’re investigating an issue, ensure all potential relevant logic gates are covered.
- Try to keep loggers under logic gates if multiple flows exist.
- Prefer too many individual loggers over fewer densely packed loglines.
- Use prefixes to make it easier to find specific logs or groups of logs.
- When comparing the same keys across multiple loglines, ensure consistent naming and location within the line to increase expressibility.
Elements of a High-Quality Logline
When constructing a logline, I typically include three main sections:
- Prefix: A unique descriptor for all loglines around the topic (e.g. USER_PROFILE:…)
- Descriptor: A unique descriptor for a single logical expression (e.g. POST_EMAIL: would direct us to any information that was posted within emails on the server).
- Key/Value Strategy: A key or value strategy for everything else in the logline. I try to follow a key value strategy where I include the key, followed by a colon delimiter, followed by the value. I’ll frequently use a trailing delimiter as well so that it’s easy to differentiate when I am using multiple loglines together (e.g. EMAIL_POST: #{params{‘email’} – EXISTING_EMAIL: # {current_user.email}}).
Logging AntiPatterns
When constructing loglines, it’s also important to avoid pitfalls, such as:
- Multiple Identifiers: It’s important to separate multiple identifiers, especially when it includes sensitive data, such as a user’s ID, email, and username. In the event that logs are ever leaked, you don’t want a user’s sensitive data to be stored together. When storing IDs, try to replace them with a hashed_identifier whenever possible. For example, you can create a unique identifier using multiple data points (e.g. “#{self.id}#{self.salt}”) so that you are not directly logging the IDs.
- Identical Loglines in Multiple Locations: Don’t just copy and paste the same logline with the same variable output in four different spots within the flow. Always ensure there is some way of distinguishing each logline so that they are easy to differentiate.
- Logging Line Numbers to Determine Placement: As the code is modified, line numbers are constantly changing. Therefore, if you identify loglines based on line numbers, the references will no longer be relevant. When in doubt, use the naming convention discussed above.
- Logging Complete Secrets: If you absolutely must confirm secret values in production, ensure you are obfuscating the bulk of the key. For example, if it is a long number sequence, reveal only the last few identifying digits.
- Logging User Credentials: Most platforms have automatic filters that you can use, such as the Rails Params method, to filter credentials, passwords, access tokens, etc. by default. However, if you’re not careful, you could still log them with another logger. You should be cognizant when you’re logging credentials to ensure sensitive data is not bypassing the filters that naturally protect it.
CloudWatching Case Study
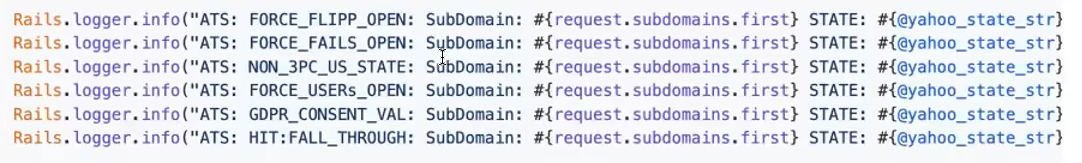
The following code is a snippet from a project I have been working on recently. We decided to quickly create some logs to understand what is happening with what users, at what places, at what times, and in what states. The initial list of logs looked like this:

Though our initial loglines were very comprehensive, there were some issues with the formatting:
- Inconsistent Spacing: If you review the image above, you’ll notice missing spaces. These spacing issues make it more challenging to quickly review and use the logs.
- Inconsistent Variable Placement: For example, all of the logs above have the “ATS” prefix, but then “SubDomain” is in different places or is missing altogether.
- Inconsistent Variable Logged: For example, the third log in the image above includes the gdpr_consent variable which is not included in any of the other logs. When we begin consuming these logs, this type of inconsistency will make them much more difficult to compare.
Extracted Log Set (Fixed)
To fix the issues mentioned above, I extracted all of the logs from the file, put them together in a line, and refactored them to be high-quality loglines:
As you can see, these lines now have consistent spacing, prefixes, and variables logged. When you are dealing with a massive line of logs, creating this type of consistency makes it much easier to quickly scan the list and see what is standing out.
CloudWatch Logs Insights
You don’t necessarily need to generate loglines in order to consume them. Most frameworks generate their own logs that you can use to your advantage.
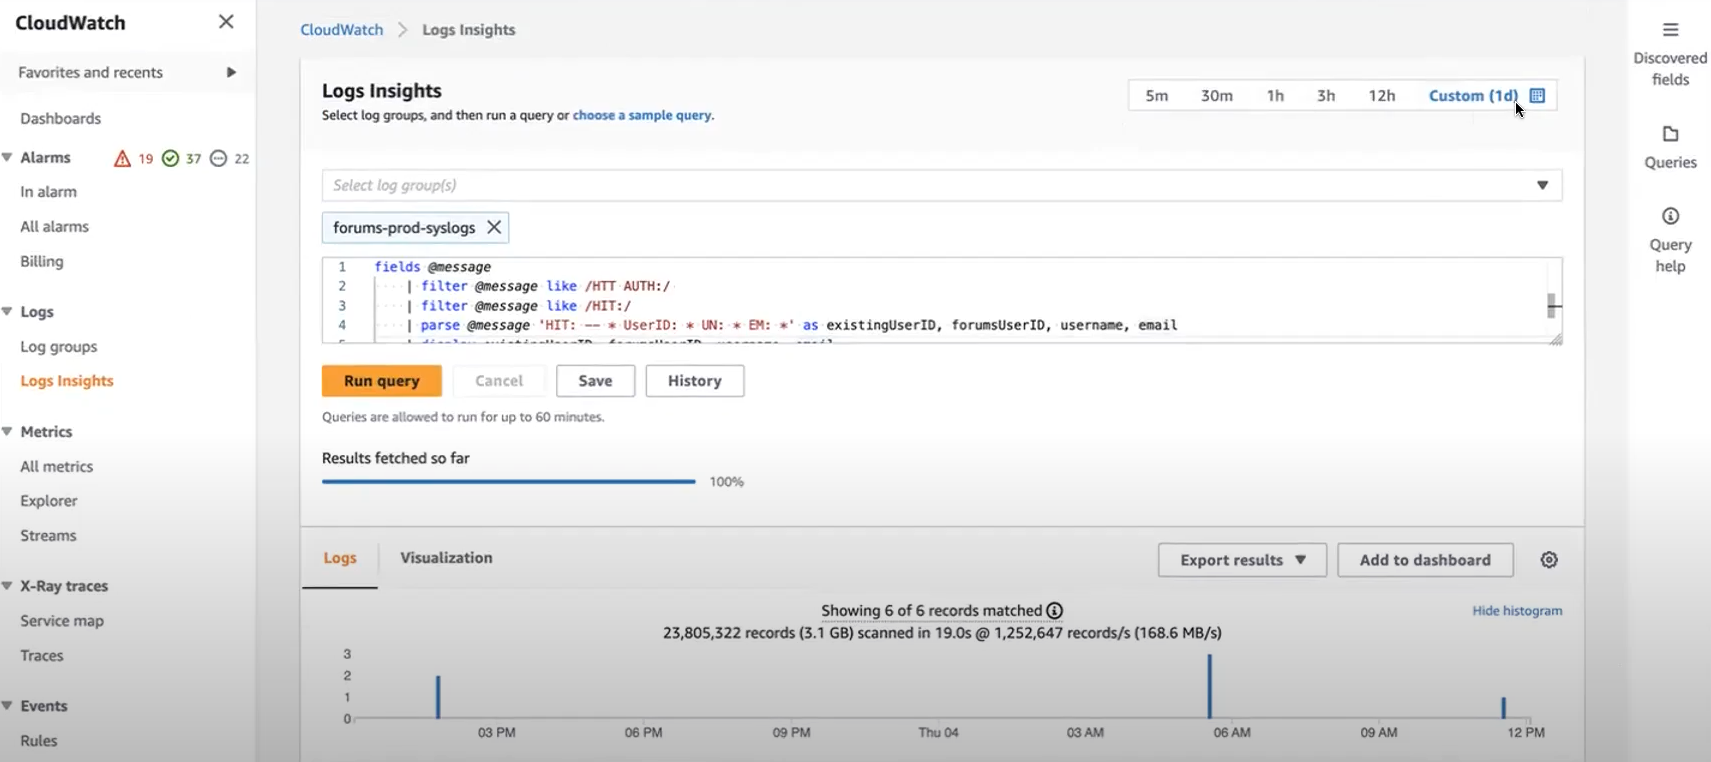
For example, CloudWatch Logs Insights give you valuable insights into your application:

Some of the components of CloudWatch Logs Insights include:
- Range: In the top right corner, you can set the range of the logs you would like to search for. You can use absolute or relative ranges and can either choose a set range or search based on certain dates.
- Logline Dropdown: Below the header, there is a dropdown menu that contains every logline in your project. You can filter through the loglines to choose only the ones you would like to analyze.
- Query Parameters: Below the dropdown list is the query field. Here, you can define the parameters of your query. Using @logstream in your query parameters will give you a link to view the logline in context with the complete log set.
- Query Results: Once you complete your query, you can view your results in the space below.
When using logline insights, it’s best to reduce the query set as much as possible with your initial filter clauses to prevent your query from returning an overwhelming number of results.
Final Thoughts
Many times, the success of an app is determined based on the developer’s ability to identify user trends and issues and adjust the app to maximize the user experience. Whether you are launching a new app, fixing a bug, making small changes, or completing a full overhaul, loglines can help you make intelligent, informed decisions as you progress.