Lessons Learned from My First HTML5 Video implementation


One of the most raging debates within the web developer community is LAMP vs. Ruby on Rails (RoR), with countless posts all over the Internet that debate the merits of one versus the other… but this blog entry isn’t going to be one of them. You see, I’m new to RoR and hesitate to call myself an LAMP expert. So I’ll just discuss my own experience going from working on PHP-based sites to working on RoR-based sites.

In the end, it’s probably Steve Jobs’ fault.
Back in April 2010, when Jobs explained why the iEmpire line wouldn’t be supporting Flash, a subset of the developer community was anticipating HTML5 as giddily as a Twilight sequel, but the majority were only marginally aware of its existence. The first preview version of IE9 had just been released. Firefox had advanced support for many HTML5 elements, but only those early-adopting developers were really paying attention.

Web mapping services are become more popular as more applications are required to display a considerable amount of data on a map. Applications use a map view most of the time to show single points but clusters of data are becoming more popular.
Before moving forward with any of the web mapping services, it is better to understand what the application really needs from the map provider. In this case our system needs just two features:
· Clustering data
· Showing a single marker on the map

In addition to outputting lots of useful information, the Rails logger can be a useful debugging tool. But debugging with the log file can become frustrating as it will be cluttered with default content. The solution to this problem is to create a custom logger and log file for such output.
The easiest way to do this is to create a global log function, enable it in your development environment, and make sure that calls to it don’t do anything in other environments.

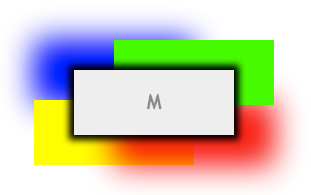
Every few months I come across the need to add shadows to frontends, and it seems each time I have to go back and look up how these things work. I always take to the internet for a brush up on box shadows, but I seem to find more information than I’m looking for – I just want a quick cheat sheet, not the War and Peace of box-shadowing. So here’s the cheat sheet I’ll be using from now on to create the shadows I need.

Up to now, many people have regarded HTML coding as simply a matter of making the content fit together and look pretty on your browser the way you want, via CSS formatting of various <div> regions. Not true anymore with HTML5, which not only introduces new content element tags but also a new algorithm that renders the contents of a web document in outline form.

There’s really no excuse for not incorporating the Google Maps API into your applications these days. It’s free, easy to use, and with version 3 you don’t even need an api key anymore (although you can still use one). What’s that I hear? You don’t need interactive maps on your site? Not good enough.
We’ll be using the Javascript V3 API.
One of the most common tasks when displaying data through an HTML table is to allow the user to manipulate data within the table. Displaying data on a grid can involve many different operations (retrieving, sorting, live editing, search). Using AJAX to dynamically fill the table requires even more work since the application (in this case, javascript code) has to convert JSON/XML/TEXT data to an HTML element. Each of these tasks can involve more or less time in order to be completed, and of course, tested.
Last night I was rummaging through some of my past projects doing a little winter cleaning, and I stumbled upon this jQuery plugin that I wrote a while back. I ran the code to see if it still functions (it was using jQuery 1.3). And to my pleasant surprise, the code still runs like a charm. So, I just want to take the time to share it with you all.